
Home Assistant Integration
This guide shows you how to surface Tigo Monitor data in Home Assistant — the Energy Dashboard, custom Lovelace views, automations, and the REST API. It’s written for hobbyist and prosumer solar owners running Home Assistant alongside the ESPHome device.
You may not need any of this. The device already serves a full built-in web dashboard — a single-page app — at
http://<device-ip>/. It shows per-string heatmaps, live panel readings, alerts, and topology out of the box, and it works under Home Assistant Ingress with no extra configuration. Hand-building Lovelace cards is an optional customization path, not a requirement. See Web Server & API for the SPA and Ingress details.
A note on entity names
Section titled “A note on entity names”Every example below uses entity IDs that Home Assistant derives from the ESPHome name: field. When you set name: "Total System Power", ESPHome exposes it as sensor.total_system_power (lowercased, spaces become underscores). So map each example to whatever you named the sensor in your own YAML.
This guide uses one consistent convention throughout:
ESPHome name: |
Home Assistant entity |
|---|---|
Total System Power |
sensor.total_system_power |
Total System Energy |
sensor.total_system_energy |
Active Device Count |
sensor.active_device_count |
East Panel 1 (power) |
sensor.east_panel_1_power |
East Panel 1 (efficiency) |
sensor.east_panel_1_efficiency |
Solar Night Mode |
binary_sensor.solar_night_mode |
Energy Dashboard
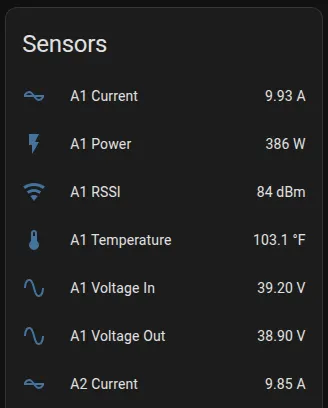
Section titled “Energy Dashboard”The component provides sensors compatible with Home Assistant’s Energy Dashboard.
- Go to Settings → Dashboards → Energy.
- Under Solar Panels, click Add Solar Production.
- Select
sensor.total_system_energy(or whatever you named your energy sensor).
Required Sensor
Section titled “Required Sensor”sensor: - platform: tigo_monitor tigo_monitor_id: tigo_hub name: "Total System Energy" # Must include "energy" in the nameReady-to-Use Dashboards
Section titled “Ready-to-Use Dashboards”The repository includes complete dashboard configurations in /examples/:
| File | Description |
|---|---|
home-assistant-dashboard.yaml |
Full desktop dashboard |
home-assistant-mobile-dashboard.yaml |
Mobile-optimized layout |
home-assistant-automations.yaml |
Alert and reporting automations |
Installation
Section titled “Installation”- Copy the content from the YAML file you want.
- Paste it into the Home Assistant dashboard editor in raw-configuration mode.
- Update the entity IDs to match your configuration (see below).
Entity Name Mapping
Section titled “Entity Name Mapping”The dashboard files use example names. Replace them with your own. The entity ID always follows from the ESPHome name: you set:
# The dashboard uses:sensor.east_panel_1_power
# Your setup might be:sensor.solar_panel_east_power
Find and replace throughout the dashboard file.
Dashboard Features
Section titled “Dashboard Features”Main Dashboard
Section titled “Main Dashboard”- System Overview: power, energy, and device-count gauges.
- Panel Grid: individual panel power output.
- Efficiency Trends: conversion efficiency over time.
- Temperature Monitoring: panel temperature graphs.
- Device Management: control buttons.
Mobile Dashboard
Section titled “Mobile Dashboard”- Compact Layout: fold-entity-row cards.
- Quick Status: glance cards for an instant overview.
- Touch-Friendly: mini-graph cards.
- Smart Summaries: best/worst performer identification.
Automation Examples
Section titled “Automation Examples”These use the current (2026) Home Assistant automation schema: triggers:, conditions:, and actions: at the top level, and action: for service calls inside actions:.
Replace
notify.mobile_app_your_phonewith your own device’s notify service. Home Assistant creates one per companion-app device — for examplenotify.mobile_app_pixel_8ornotify.mobile_app_iphone. Find yours under Developer Tools → Actions. Plainnotify.mobile_appis not a valid target.
Low Efficiency Alert
Section titled “Low Efficiency Alert”automation: - alias: "Panel Low Efficiency Alert" triggers: - trigger: numeric_state entity_id: sensor.east_panel_1_efficiency below: 85 for: "00:30:00" actions: - action: notify.mobile_app_your_phone # replace with your device data: message: "East Panel 1 efficiency dropped below 85%"Device Count Alert
Section titled “Device Count Alert”automation: - alias: "Missing Devices Alert" triggers: - trigger: numeric_state entity_id: sensor.active_device_count below: 15 # your expected count actions: - action: notify.mobile_app_your_phone # replace with your device data: message: "Tigo system has fewer active devices than expected"High Temperature Warning
Section titled “High Temperature Warning”automation: - alias: "Panel High Temperature" triggers: - trigger: numeric_state entity_id: sensor.east_panel_1_temperature above: 70 actions: - action: notify.mobile_app_your_phone # replace with your device data: message: "East Panel 1 temperature exceeds 70°C"Daily Energy Report
Section titled “Daily Energy Report”automation: - alias: "Daily Solar Report" triggers: - trigger: time at: "20:00:00" actions: - action: notify.mobile_app_your_phone # replace with your device data: message: > Today's solar: {{ states('sensor.total_system_energy') }} kWh Peak: {{ states('sensor.total_system_peak_power') }} WUseful Sensors
Section titled “Useful Sensors”System Health
Section titled “System Health”sensor: - platform: tigo_monitor tigo_monitor_id: tigo_hub name: "Active Device Count"
- platform: tigo_monitor tigo_monitor_id: tigo_hub name: "Missed Frame Count"
binary_sensor: - platform: tigo_monitor tigo_monitor_id: tigo_hub night_mode: name: "Solar Night Mode"Per-Panel Monitoring
Section titled “Per-Panel Monitoring”sensor: - platform: tigo_monitor tigo_monitor_id: tigo_hub address: "1234" name: "East Panel 1" power: {} efficiency: {} temperature: {}With name: "East Panel 1", Home Assistant exposes sensor.east_panel_1_power, sensor.east_panel_1_efficiency, and sensor.east_panel_1_temperature.
Template Sensors
Section titled “Template Sensors”Best Performing Panel
Section titled “Best Performing Panel”template: - sensor: - name: "Best Panel Power" unit_of_measurement: "W" state: > {{ [ states('sensor.east_panel_1_power') | float(0), states('sensor.east_panel_2_power') | float(0), states('sensor.east_panel_3_power') | float(0) ] | max }}System Efficiency
Section titled “System Efficiency”template: - sensor: - name: "System Average Efficiency" unit_of_measurement: "%" state: > {% set panels = [ states('sensor.east_panel_1_efficiency') | float(0), states('sensor.east_panel_2_efficiency') | float(0), states('sensor.east_panel_3_efficiency') | float(0) ] %} {{ ((panels | sum) / (panels | length)) | round(1) }}Lovelace Cards
Section titled “Lovelace Cards”Power Gauge
Section titled “Power Gauge”type: gaugeentity: sensor.total_system_powername: Solar Powerunit: Wmin: 0max: 10000severity: green: 5000 yellow: 2000 red: 0Energy Today
Section titled “Energy Today”type: entityentity: sensor.total_system_energyname: Energy Todayicon: mdi:solar-powerPanel Grid
Section titled “Panel Grid”type: gridcolumns: 4cards: - type: entity entity: sensor.east_panel_1_power name: Panel 1 - type: entity entity: sensor.east_panel_2_power name: Panel 2 # ... more panelsAPI Access
Section titled “API Access”You can also pull Tigo Monitor data through the REST API instead of ESPHome-native sensors.
rest: - resource: http://192.168.1.100/api/overview scan_interval: 60 sensor: - name: "Tigo API Power" value_template: "{{ value_json.total_power }}" unit_of_measurement: "W"With authentication:
rest: - resource: http://192.168.1.100/api/overview headers: Authorization: Bearer your-api-token scan_interval: 60See Web Server & API for the full endpoint list and token setup.
- Use meaningful names in your ESPHome config — the entity ID follows the
name:, so clear names make HA entities easy to find. - Enable the Energy Dashboard for long-term production tracking.
- Set up efficiency alerts to catch underperforming panels early.
- Watch the device-count sensor to detect communication problems.
- Use the night-mode binary sensor to gate automations that should only run in daylight.
See also: Web Server & API · Configuration · Troubleshooting · ← Back to README